
As the U.S. economy enters its 10th year of expansion, many pundits are starting to ask when the party will be over. Some even believe the next downturn in the economy is imminent. While none of us have that crystal ball, it’s worth recalling what a recession actually looks like.
According to Ronald Reagan during the 1980 presidential campaign, “Recession is when your neighbor loses his job. Depression is when you lose yours. And recovery is when Jimmy Carter loses his”. Less politically, a common definition for a recession is two consecutive quarters of declining real GDP (gross domestic product minus inflation). The National Bureau of Economic Research (NBER), the official recession dating organization, offers a more qualitative definition as “a significant decline in economic activity spread across the economy, lasting more than a few months, normally visible in real GDP, real income, employment, industrial production, and wholesale-retail sales”.
The chart below represents real GDP between 1948 and 2018. The gray, vertical lines represent recessions. Not surprisingly, in every recession, real GDP has declined.
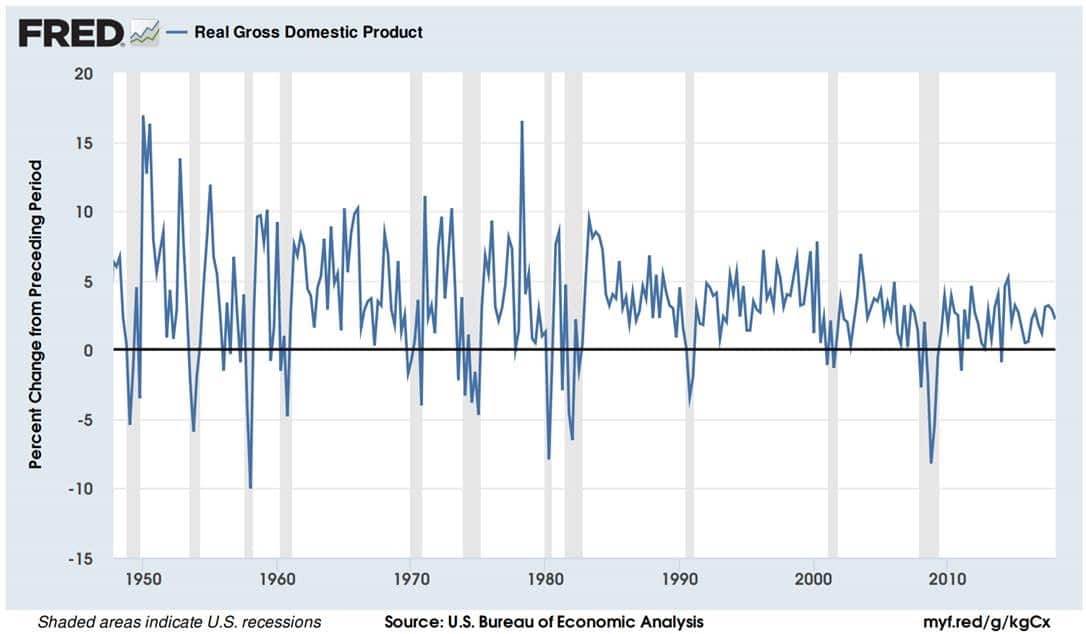
The 11 recessions in the past 70 years give us a fair amount of data to examine:
- On average, recessions happen every 6.4 years
- The longest time between recessions was 10 years (during the boom of the ‘90s)
- The shortest time between recessions was one year (between the 1980 and 1981 recessions)
- Recessions last, on average, around 11 months
- The longest recession was the “Great Recession” in ‘08 at 18 months
- The shortest recession was the 1980 recession at 6 months
The most severe recession in terms of magnitude (measured as the decline in peak-to-trough GDP) and length is the one freshest in our minds, the Great Recession of 2008-2009. Since it’s human nature to set our expectations based on our most recent experience (recency bias), it’s no wonder, given the severity of the last recession, the ‘R’ word is anxiety-inducing.
Is another recession coming?
Recessions are a normal part of the business/economic cycle. In an expansion, employment is strong, the economy is growing, and prices are generally rising. High business confidence and increasing demand typically lead to investment (e.g. hiring) to create more capacity. After the expansion peaks and demand wanes, businesses are stuck with excess capacity and need to start cutting back, which affects other areas of the economy (e.g. consumer spending). This is a garden-variety recession. Then, when the economy stops contracting, we can start back on the road to recovery.
In our opinion, the U.S. is somewhere between mid and late expansion territory. It’s been over 9 years since the last recession, which is above the 6.4-year average and the second longest streak without one. It would be completely reasonable to expect a recession in the next few years.
What does a recession mean for your portfolio?
Just because we will see another recession in the future doesn’t mean it will resemble the last one in terms of stock market performance. Below is a table of stock market returns before, during and after recessions:
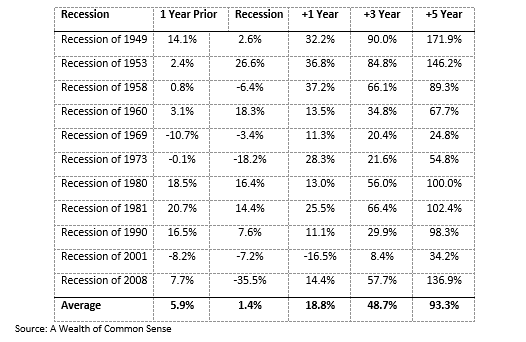
As you can see, it’s a mixed bag. We saw the biggest stock market decline during the last recession. However, on average, stocks have been positive in the periods leading up to, during and after recessions. While we don’t know what our experience will be the next time around, we do know the longer the holding period, the lower the chance of negative returns. For example, in any given year the return for a portfolio of 50% stocks and 50% bonds could be between +33% and -15%, but, per the chart below, the 10-year average annual return for a 50/50 portfolio has been between +2% and +16%.
How do we manage recession risk in portfolios?
In addition to keeping a long-term investment philosophy, we utilize a number of economic indicators in the management of portfolios. These indicators are designed to help us get more conservative (i.e. less stock exposure) when they are negative and more growth-oriented (i.e. more stock exposure) when they are positive. Today, we have offsetting positive and negative indicators leading to a “neutral” equity weighting.
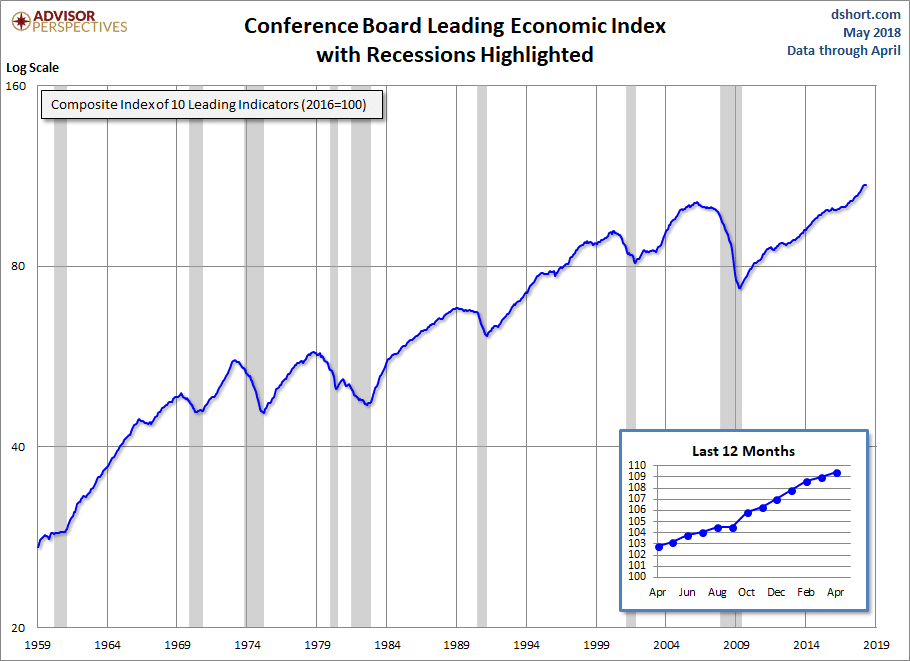
One of our indicators is based on the Leading Economic Index (LEI) from the Conference Board, a non-profit economic research organization. The LEI is made up of ten underlying indicators that typically lead the economy, such as building permits and unemployment insurance. As you can see below, the LEI usually declines in advance of recessions. Currently, the LEI is not pointing to an imminent recession, which is a positive in our set of indicators.
Our takeaway
Recessions are normal and expected part of the economic cycle, and we should not be surprised when the next one arrives. While our economic data doesn’t point to a recession today, recall that we build client portfolios to endure recession, not avoid them, and that in the long run the swings of the economic cycle are smoothed-out by time and a proper diversification.
As always, we will continue to assess market conditions and make portfolio adjustments should our economic indicators change. If you have any questions, please don’t hesitate to reach out to your Advisor.
