

After the uncomfortable 4th quarter last year (when stocks declined 14%), we wrote about a few items keeping our attention. Besides our indicators (which were negative at the time), the trade war with China and the Fed tightening monetary policy were top of mind. Here we are three months later and the negative trajectory of each item has reversed course sending stocks 13% higher. This increase basically recoups most of the previous quarter’s decline. If we were on a boat experiencing these ups and downs, we’d all be seasick!
Last month we passed the 10 year anniversary of the Financial Crisis lows. On March 6th, 2009 the S&P 500 touched 666. For context, it traded at 1,576 five months earlier, a decline of 58%. Today, the S&P 500 is trading around 2,800, 320% higher than the ’09 lows and 78% higher than the ’07 highs. It was a once in a lifetime opportunity for anyone who bought in the midst of the panic. Of course, hindsight is 20/20 and it’s a lot easier to see that now than during the storm.
Everyone learned a lot throughout the Financial Crisis and its aftermath (at least we hope so!). Here are a few of our favorite lessons:
- The storm will pass – even though it may not feel like it at the time
- Choose the right boat – the right portfolio is different for everyone and minimizes the risk of abandoning ship
- Trim the sails – there are telltale signs that must constantly be monitored and used to adjust investment strategy
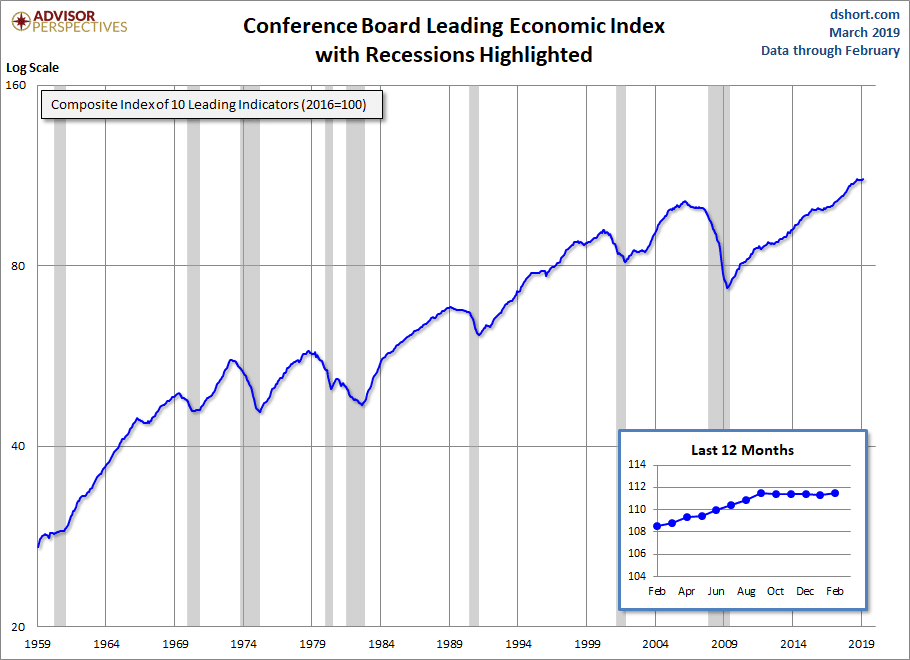
It’s the last point here we’d like to highlight in this letter. While there is no indicator or set of indicators that is 100% accurate in determining market turning points, we believe there are certain warning flags that have helped more often than not. One of these is the Leading Economic Index (LEI), one of our five main indicators. The Conference Board (an economic think tank) has assembled a list of ten underlying indicators that tend to decline and improve before the economy as a whole. Of these ten, the biggest weight is given to average weekly hours worked in manufacturing, new manufacturing orders, consumer expectations for business conditions and the interest rate spread (10 year Treasury bond yield minus the Fed Funds rate). The LEI usually leads other economic statistics like the unemployment rate.
As you can see in the chart below, the LEI usually declines before recessions and market downturns. This indicator has been phenomenally resilient since it bottomed in March of 2009. While the LEI is still growing, it is starting to lose some momentum (as seen in the “Last 12 Months” pop-out). And like a telltale wind indicator on a sailboat, we are keeping a close eye on this. The LEI data is updated every month, and while there have been months it has declined, we look at the change over the last six months. This helps smooth out the month-to-month choppiness inherent in this type of data and capture a more meaningful change in direction.
Click image to enlarge
We add this indicator in with our other indicators and when the combination of them changes direction, we take note and trim the sails of your portfolio. If it looks like we’ll be sailing into the wind, like in the Winter of 2008, we’ll get more conservative and sell some stocks. Conversely, if it appears there are clear skies ahead, like in the Summer of 2009, we’ll get less conservative and buy more stocks.
As you may recall, our indicators turned positive at the end of January (after being negative since the end of November) and we are currently positioned 5% above baseline stock allocations. We will be manning the ship and will communicate any investment changes to you.
Best,
Mike Gallagher and the TPG Investment Committee

Source: Yahoo Finance

